
Figures, tables, percentages, survey results… Organisations produce and publish more and more data. But you still have to know how to make it understandable.
That is the whole point of data visualisation: turning complex information into clear, accessible and useful visual representations. Much more than a question of design, it is a genuine communication tool that makes information easier to understand, brings the key issues into focus and supports decision-making.
But how do you go from a table of figures to an effective visualisation? And why call on specialists in infographics and information design?
Data visualisation: much more than a good-looking infographic
An infographic catches the eye. A good data visualisation goes further: it gives meaning to the figures.
It lets you spot a trend, compare results, understand how something is changing or bring out a phenomenon. Where a table presents data, a well-designed visualisation shows what the data reveals.
Take an example: a report states that nearly one young person in three has been a victim of cyberbullying. The figure matters, but its weight stays abstract when it is buried in a scientific document. Presented visually, it immediately becomes more concrete.
That is the difference: it is not simply about making figures look better, but about making them speak.
Infographic and data visualisation: what is the difference?
The two disciplines are close, but they do not serve exactly the same purpose.
- Infographic: combines text, illustrations, pictograms and figures to explain a subject concisely.
- Data visualisation: represents data visually to bring out relationships, trends and lessons.
The two approaches often complement each other: an infographic can include several visualisations to tell a story and make a complex subject easier to understand.
Why visualise your data? What research says
The benefits of visual communication do not rest on graphic intuition alone. Several studies in cognitive science have looked at the effect of visual representations on understanding and memory.
One study, published in 2025 in Psychonomic Bulletin & Review, looked at how well data is remembered. Two hours after viewing information, participants who had studied graphs recalled the general trends more accurately than those who had read text: the error rate was 6% and 27% respectively. Read the study (2025).
This research shows that visualisation can add real value, particularly for remembering the main trends and understanding complex information.
In practice, a well-designed data visualisation helps you to:
- Simplify technical or scientific information.
- Compare results and highlight differences.
- Identify trends and phenomena.
- Remember the key messages.
- Decide on the basis of more accessible information.
A word of caution:though: a chart does not automatically guarantee better understanding. Everything depends on how the data is selected, organised and presented. That is why it is essential to entrust it to a professional.
Why entrust your data to experts?
Tools now make it possible to create a chart in a few clicks. But producing a visual and designing a genuine data visualisation are two different things.
Expertise comes in well before the choice of colours or typefaces. It starts with understanding the data and the message to convey.
1. Select the data that matters
A report can contain hundreds of indicators. Not all of them deserve to be represented. You have to identify the significant results and select the information that really serves the message.
2. Build a story around the figures
A series of charts is not enough to make a subject understood. The data must follow a reading logic: what are the findings? What changes should we look at? What lessons can we draw? That is the role of data storytelling: giving meaning to figures and guiding the reader to the essential message.
3. Make it easy to read
Information hierarchy, typography, colours, proportions, legends and the organisation of space: every graphic choice must help people understand. Readers should know where to look, what to compare and which piece of information to remember.
4. Guarantee the fidelity of the data
A poorly chosen scale, a figure taken out of context or an inappropriate comparison can change how a result is perceived. The designer’s role is also to preserve the accuracy of the information. A visualisation should make reading simpler, never make reality simpler.
What types of projects suit an agency that specialises in data visualisation?
As soon as your data is extensive, complex or aimed at several audiences, a professional approach makes the difference. A few examples:
- CSR reports: making environmental and social commitments and results visible.
- Institutional publications: summarising studies and making public policies more accessible.
- Financial data: illustrating changes and making results easier to compare.
- Scientific research: making the work accessible and its conclusions understandable.
- Activity reports: showcasing an organisation’s achievements and results.
The aim is to adapt how the data is represented to the people who will read it and to the messages they need to remember.
When data becomes a visual language
The example of Stefanie Posavec
Data visualisation can also go beyond traditional charts and become a field of creative expression.
This is what the work of Stefanie Posavec, a designer and artist specialising in information design, shows. With Dear Data, she and Giorgia Lupi documented their daily lives for a year, turning their habits, emotions and activities into hand-drawn postcards.
The project shows that data is not just numbers: it can tell stories, reveal behaviour and stir emotions. This approach to information design has also been showcased in Luxembourg by Design Friends.
Data visualisation in practice
The OEJQS example in Luxembourg
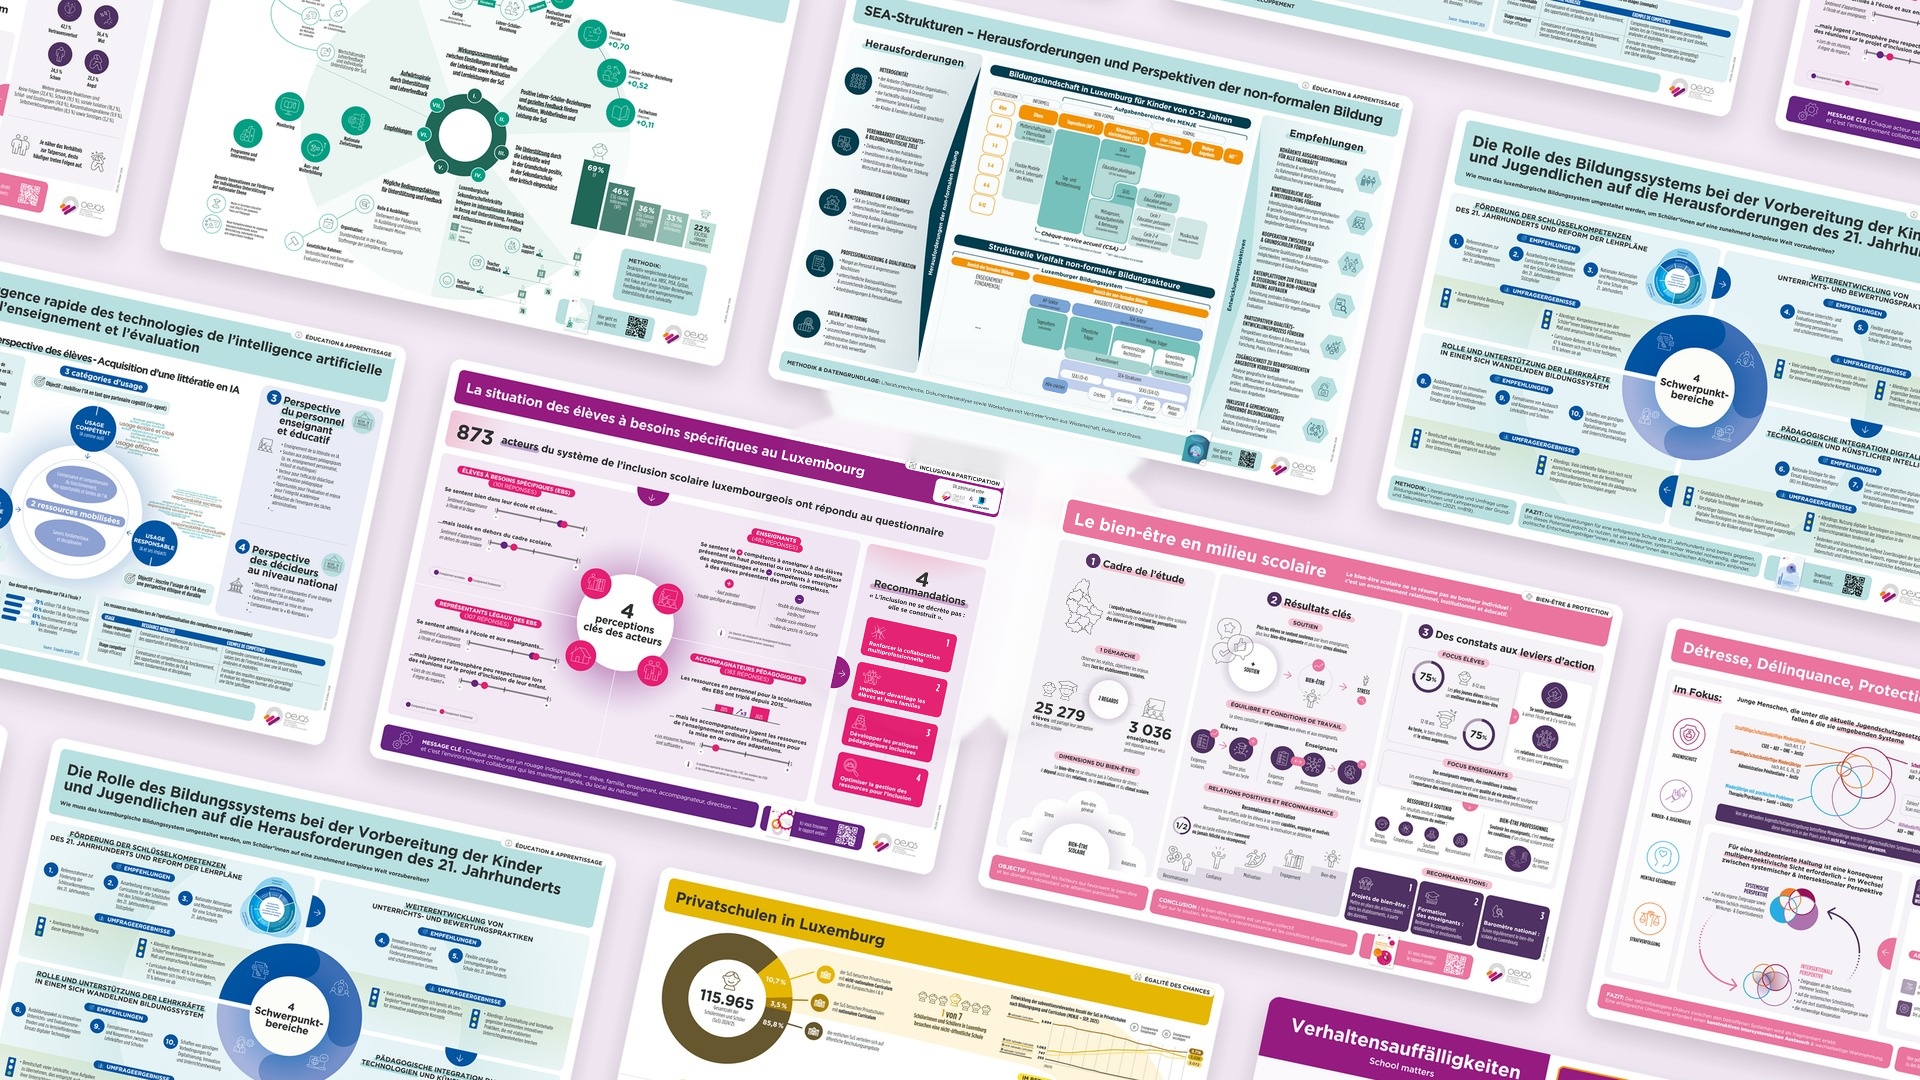
How do you apply these principles to an institutional project? The work carried out for the Observatoire national de l’enfance, de la jeunesse et de la qualité scolaire (OEJQS), Luxembourg’s national observatory for children, youth and school quality, is a concrete example.
Starting from hundreds of pages of research and surveys on Luxembourg’s education system, we designed ten visualisations around six themes. Our mission was to structure the information, prioritise the results and design materials consistent with the Observatory’s graphic codes.
The result: tools that make the research easier to understand, for decision-makers and the general public alike.
The City of Luxembourg example: the 2024 environmental figures
We have supported the City of Luxembourg in the layout of its environmental report since the 2021/2022 edition. For the 2024 edition, we also designed an infographic leaflet that condenses the report with a series of data visualisations highlighting the main results, and a motion design video that gives an interactive overview.
Your data has something to say.
Let’s give it the right form.
A study, a report, survey results or an activity review: your data often holds essential information that deserves to be brought to light.
At h2a, we help companies, institutions and organisations in Luxembourg and the Greater Region design infographics and data visualisations.
From data analysis to graphic design, we make your information understandable, relevant and accessible to your audiences.