At h2a, using infographics has become an essential ally of any good communication strategy.
Infographics naturally bring added value to content: they improve search ranking, summarize and simplify complex data, and so allow the reader to grasp the key information in a matter of moments.
We increasingly recommend their use for annual reports, minutes of meetings, or to illustrate a company’s values.
One must be able to analyse, understand and summarize content in a relevant way.
For the agency that carries out this infographic work, it is a real challenge: it must be able to analyse, understand and summarize content in a relevant way. It must then create a distinctive graphic and iconographic universe in order to render all the information, while being able to identify and highlight the main messages.
In short, every infographic is a real challenge. But you know what? At h2a we love it!
Example produced for the Luxembourg Institute of Regulation
For almost five years, the Luxembourg Institute of Regulation (ILR) has entrusted us with its brand image. One of the Institute’s missions is to inform the general public about the actions taken across the country in the energy, telecommunications and postal services sectors.
For the production of their annual report on the energy sector, we decided to use infographics to transform, once and for all, their tedious Word document. Below is an original extract of around a hundred words:
« Electricity production from renewable sources rose to 605 GWh (up 31% compared with 2016), corresponding to 9.25% of national consumption. Connection requests for 57 MW of renewable electricity generation capacity were submitted to the network operators in 2017. Although the vast majority of these plants had not yet been commissioned in 2017, this indicates that electricity generation capacity, which stood at 426 MW on 31.12.2017, including 309 MW of renewable capacity, will continue to increase in the years to come. »
And here is the result in pictures:
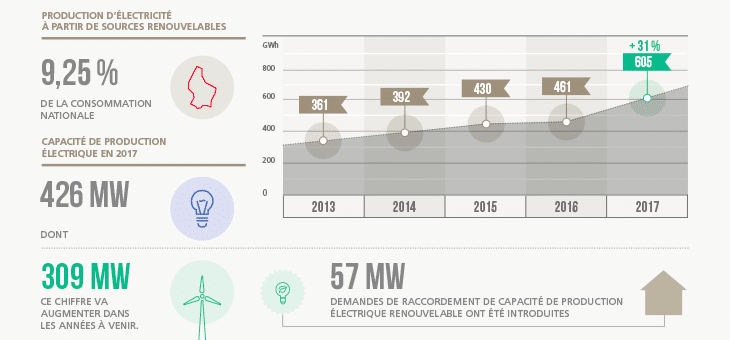
The key figures are now clearly identified, the charts catch the eye and make you want to know more, and the iconography illustrates the document in a playful way.